
Continued: DataFrame & Matplotlib
Identifying Values: Columns, Rows
Column Names, Values: .columns
list(file1.columns) # checks all the columns, puts column names in list
['ID',
 'LIMIT_BAL',
 'SEX',
 'EDUCATION',
 'MARRIAGE',
 'AGE',
 'PAY_0',
 'PAY_2',
 'PAY_3',
 'PAY_4',
 'PAY_5',
 'PAY_6',
 'BILL_AMT1',
 'BILL_AMT2',
 'BILL_AMT3',
 'BILL_AMT4',
 'BILL_AMT5',
 'BILL_AMT6',
 'PAY_AMT1',
 'PAY_AMT2',
 'PAY_AMT3',
 'PAY_AMT4',
 'PAY_AMT5',
 'PAY_AMT6',
 'default payment next month']
file1['ID'].head() # checks for column: 'ID'
0    1
1    2
2    3
3    4
4    5
Name: ID, dtype: int64
file1['EDUCATION'].head() # checks for column: "EDUCATION"
0    2
1    2
2    2
3    2
4    2
Name: EDUCATION, dtype: int64
Row Names, Values: .index and .iloc[]
list(file1.index)[0:6] # puts the row index numbers into a list, displays first five elements
[0, 1, 2, 3, 4, 5]
file1.iloc[0] # prints the first row with index zero.
ID                                1
LIMIT_BAL                     20000
SEX                               2
EDUCATION                         2
MARRIAGE                          1
AGE                              24
PAY_0                             2
PAY_2                             2
PAY_3                            -1
PAY_4                            -1
PAY_5                            -2
PAY_6                            -2
BILL_AMT1                      3913
BILL_AMT2                      3102
BILL_AMT3                       689
BILL_AMT4                         0
BILL_AMT5                         0
BILL_AMT6                         0
PAY_AMT1                          0
PAY_AMT2                        689
PAY_AMT3                          0
PAY_AMT4                          0
PAY_AMT5                          0
PAY_AMT6                          0
default payment next month        1
Name: 0, dtype: int64
Value At Row X, Column Y: .at[]
file1.at[0, 'EDUCATION'] # prints value at index zero, column "EDUCATION"
2
Checking Data Type: .dtypes
file1.dtypes # checks data types of each column
ID                            int64
LIMIT_BAL                     int64
SEX                           int64
EDUCATION                     int64
MARRIAGE                      int64
AGE                           int64
PAY_0                         int64
PAY_2                         int64
PAY_3                         int64
PAY_4                         int64
PAY_5                         int64
PAY_6                         int64
BILL_AMT1                     int64
BILL_AMT2                     int64
BILL_AMT3                     int64
BILL_AMT4                     int64
BILL_AMT5                     int64
BILL_AMT6                     int64
PAY_AMT1                      int64
PAY_AMT2                      int64
PAY_AMT3                      int64
PAY_AMT4                      int64
PAY_AMT5                      int64
PAY_AMT6                      int64
default payment next month    int64
dtype: object
Checking Data Values: .unique()
file1['EDUCATION'].unique() # returns unique values in column 'education'
array([2, 1, 3, 5, 4, 6, 0], dtype=int64)
Location of Specific Values: .loc[]
file1.loc[file1['AGE'] == 25].head() # locates and shows all rows where AGE == 25
| ID | LIMIT_BAL | SEX | EDUCATION | MARRIAGE | AGE | PAY_0 | PAY_2 | PAY_3 | PAY_4 | ... | BILL_AMT4 | BILL_AMT5 | BILL_AMT6 | PAY_AMT1 | PAY_AMT2 | PAY_AMT3 | PAY_AMT4 | PAY_AMT5 | PAY_AMT6 | default payment next month | |
|---|---|---|---|---|---|---|---|---|---|---|---|---|---|---|---|---|---|---|---|---|---|
| 38 | 39 | 50000 | 1 | 1 | 2 | 25 | 1 | -1 | -1 | -2 | ... | 0 | 0 | 0 | 780 | 0 | 0 | 0 | 0 | 0 | 1 |
| 41 | 42 | 70000 | 2 | 1 | 2 | 25 | 0 | 0 | 0 | 0 | ... | 63699 | 64718 | 65970 | 3000 | 4500 | 4042 | 2500 | 2800 | 2500 | 0 |
| 53 | 54 | 180000 | 2 | 1 | 2 | 25 | 1 | 2 | 0 | 0 | ... | 43510 | 44420 | 45319 | 1300 | 2010 | 1762 | 1762 | 1790 | 1622 | 0 |
| 76 | 77 | 50000 | 1 | 3 | 2 | 25 | -1 | 0 | 0 | 0 | ... | 9636 | 9590 | 10030 | 1759 | 1779 | 320 | 500 | 1000 | 1000 | 0 |
| 151 | 152 | 80000 | 1 | 1 | 2 | 25 | 0 | 0 | 0 | 0 | ... | 41087 | 41951 | 31826 | 30000 | 3000 | 6000 | 8000 | 2000 | 14000 | 0 |
5 rows × 25 columns
Matplotlib
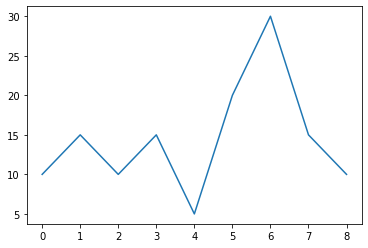
Plotting Lists: .plot()
import matplotlib.pyplot as plt
import numpy as np
data = [10, 15, 10, 15, 5, 20, 30, 15, 10]
plt.plot(data)
plt.show()
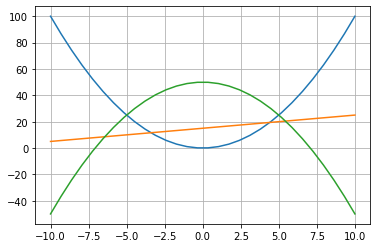
Plotting on Same Graph: .plot(x,y1,x,y2 ...)
import numpy as np
X = np.linspace(-10, 10, num=30, endpoint=True)
y1=X**2
y2=X+15
y3=-X**2 + 50
plt.plot(X,y1, X,y2, X,y3)
plt.grid(True)
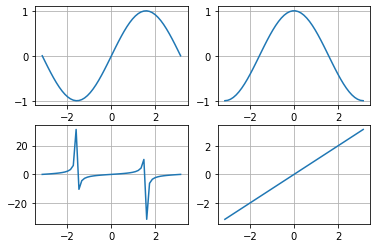
Subplot: .subplot()
X = np.linspace(-np.pi,np.pi, num=50, endpoint=True)
y1 = np.sin(X)
y2 = np.cos(X)
y3 = np.tan(X)
y4 = X
plt.subplot(2,2,1)
plt.plot(X,y1)
plt.grid(True)
plt.subplot(2,2,2)
plt.plot(X,y2)
plt.grid(True)
plt.subplot(2,2,3)
plt.plot(X,y3)
plt.grid(True)
plt.subplot(2,2,4)
plt.plot(X,y4)
plt.grid(True)
plt.show()
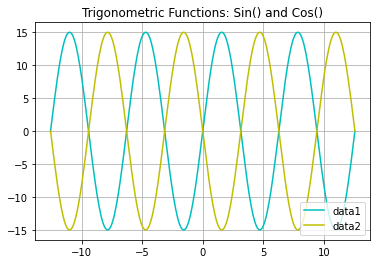
Adding Legend: .legend
import numpy as np
import matplotlib.pyplot as plt
X = np.linspace(-4*np.pi,4*np.pi, num=320, endpoint=True)
y5 = np.sin(X) * 15
y6 = np.sin(X) * -15
plt.plot(X, y5, 'c', X, y6, 'y')
plt.grid(True)
plt.legend(['data1', 'data2'], loc = 'lower right')
plt.title('Trigonometric Functions: Sin() and Cos()')
plt.show() # b: blue, g: green, c: cyan, r:red, etc
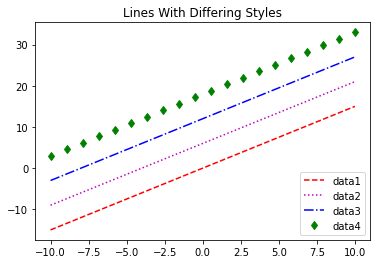
Style of Lines: (Use parameters)
X = np.linspace(-10,10, num=20)
y1 = 1.5*X
y2 = 1.5*X + 6
y3 = 1.5*X + 12
y4 = 1.5*X + 18
plt.plot(X, y1, '--r', X, y2, ':m', X, y3, '-.b', X, y4, 'dg')
plt.legend(['data1', 'data2','data3', 'data4'], loc = 'lower right')
plt.title('Lines With Differing Styles')
plt.show()
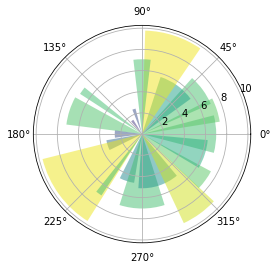
Radar Charts
import numpy as np
import matplotlib.pyplot as plt
# Fixing random state for reproducibility
np.random.seed(19680801)
# Compute pie slices
N = 20
theta = np.linspace(0.0, 2 * np.pi, N, endpoint=False)
radii = 10 * np.random.rand(N) # adjust radii by setting 10 to a different number. Right now, radii is between 0 and 10
width = np.pi / 4 * np.random.rand(N) # adjust width by setting 6 to a different number
colors = plt.cm.viridis(radii / 10.) # adjust color: viridis, magma, plasma, inferno
ax = plt.subplot(projection='polar')
ax.bar(theta, radii, width=width, bottom=0.0, color=colors, alpha=0.5)
plt.show()
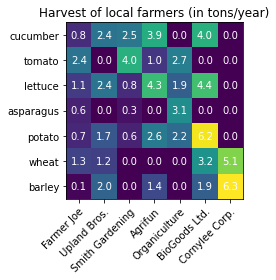
Heatmap
import pandas as pd
import numpy as np
vegetables = ["cucumber", "tomato", "lettuce", "asparagus",
              "potato", "wheat", "barley"]
farmers = ["Farmer Joe", "Upland Bros.", "Smith Gardening",
           "Agrifun", "Organiculture", "BioGoods Ltd.", "Cornylee Corp."]
harvest = [[0.8, 2.4, 2.5, 3.9, 0.0, 4.0, 0.0],
                    [2.4, 0.0, 4.0, 1.0, 2.7, 0.0, 0.0],
                    [1.1, 2.4, 0.8, 4.3, 1.9, 4.4, 0.0],
                    [0.6, 0.0, 0.3, 0.0, 3.1, 0.0, 0.0],
                    [0.7, 1.7, 0.6, 2.6, 2.2, 6.2, 0.0],
                    [1.3, 1.2, 0.0, 0.0, 0.0, 3.2, 5.1],
                    [0.1, 2.0, 0.0, 1.4, 0.0, 1.9, 6.3]]
df1 = pd.DataFrame(harvest, columns=farmers, index=vegetables)
df1
| Farmer Joe | Upland Bros. | Smith Gardening | Agrifun | Organiculture | BioGoods Ltd. | Cornylee Corp. | |
|---|---|---|---|---|---|---|---|
| cucumber | 0.8 | 2.4 | 2.5 | 3.9 | 0.0 | 4.0 | 0.0 |
| tomato | 2.4 | 0.0 | 4.0 | 1.0 | 2.7 | 0.0 | 0.0 |
| lettuce | 1.1 | 2.4 | 0.8 | 4.3 | 1.9 | 4.4 | 0.0 |
| asparagus | 0.6 | 0.0 | 0.3 | 0.0 | 3.1 | 0.0 | 0.0 |
| potato | 0.7 | 1.7 | 0.6 | 2.6 | 2.2 | 6.2 | 0.0 |
| wheat | 1.3 | 1.2 | 0.0 | 0.0 | 0.0 | 3.2 | 5.1 |
| barley | 0.1 | 2.0 | 0.0 | 1.4 | 0.0 | 1.9 | 6.3 |
import numpy as np
import matplotlib
import matplotlib.pyplot as plt
vegetables = ["cucumber", "tomato", "lettuce", "asparagus",
              "potato", "wheat", "barley"]
farmers = ["Farmer Joe", "Upland Bros.", "Smith Gardening",
           "Agrifun", "Organiculture", "BioGoods Ltd.", "Cornylee Corp."]
harvest = np.array([[0.8, 2.4, 2.5, 3.9, 0.0, 4.0, 0.0],
                    [2.4, 0.0, 4.0, 1.0, 2.7, 0.0, 0.0],
                    [1.1, 2.4, 0.8, 4.3, 1.9, 4.4, 0.0],
                    [0.6, 0.0, 0.3, 0.0, 3.1, 0.0, 0.0],
                    [0.7, 1.7, 0.6, 2.6, 2.2, 6.2, 0.0],
                    [1.3, 1.2, 0.0, 0.0, 0.0, 3.2, 5.1],
                    [0.1, 2.0, 0.0, 1.4, 0.0, 1.9, 6.3]])
fig, ax = plt.subplots()
im = ax.imshow(harvest)
# We want to show all ticks...
ax.set_xticks(np.arange(len(farmers)))
ax.set_yticks(np.arange(len(vegetables)))
# ... and label them with the respective list entries
ax.set_xticklabels(farmers)
ax.set_yticklabels(vegetables)
# Rotate the tick labels and set their alignment.
plt.setp(ax.get_xticklabels(), rotation=45, ha="right",
         rotation_mode="anchor")
# Loop over data dimensions and create text annotations.
for i in range(len(vegetables)):
    for j in range(len(farmers)):
        text = ax.text(j, i, harvest[i, j],
                       ha="center", va="center", color="w")
ax.set_title("Harvest of local farmers (in tons/year)")
fig.tight_layout()
plt.show()
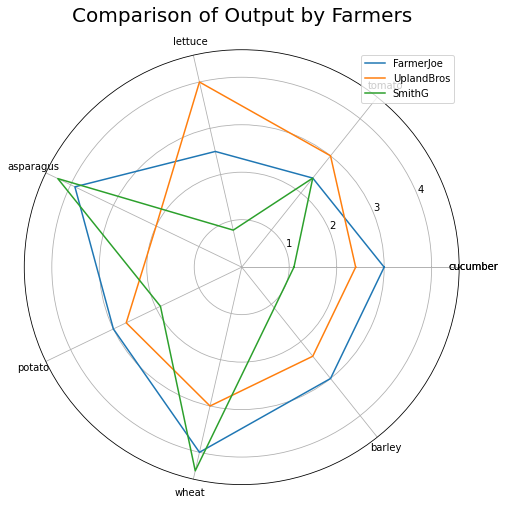
Spidermap
import matplotlib.pyplot as plt
import numpy as np
vegetables = ["cucumber", "tomato", "lettuce", "asparagus",
              "potato", "wheat", "barley"]
vegetables = [*vegetables, vegetables[0]]
FarmerJoe = [3, 2.4, 2.5, 3.9, 3, 4.0, 3]
UplandBros = [2.4, 3.0, 4.0, 2.0, 2.7, 3.0, 2.4]
SmithG = [1.1, 2.4, 0.8, 4.3, 1.9, 4.4, 1.1]
FarmerJoe = [*FarmerJoe, FarmerJoe[0]]
UplandBros = [*UplandBros, UplandBros[0]]
SmithG = [*SmithG, SmithG[0]]
label_loc = np.linspace(start=0, stop=2 * np.pi, num=len(FarmerJoe))
plt.figure(figsize=(8, 8))
plt.subplot(polar=True)
plt.plot(label_loc, FarmerJoe, label='FarmerJoe')
plt.plot(label_loc, UplandBros, label='UplandBros')
plt.plot(label_loc, SmithG, label='SmithG')
plt.title('Comparison of Output by Farmers', size=20, y=1.05)
lines, labels = plt.thetagrids(np.degrees(label_loc), labels=vegetables)
plt.legend()
plt.show()
Conclusion
As the saying goes, one never know something until one tries it. Even though there are countless tutorials and other informative resources related to python modules on the web, until one actually runs the code and inspect the meaning behind each line of code, one cannot ascertain whether one really knows what is going on. Also, if one does not make a record of what one learned, he or she will inevitably end up forgetting it. In this post, I decided to create my own personal reference guide for the pandas and numpy library functions. Even though there are better, more informative guides on the web, I believe that reviewing past resources to re-learn, reuse, or reconfigure code is better than borrowing random code on Stack Overflow that one does not understand. In light of the claim, I should probably remind myself occasionally to organize systematically what I learned about python modules. This is the end of the post, and thank for reading.